

Minding the Gap: Making Sense of the Release Burndown Chart
/
Whether Product Owners use a burndown or a burnup chart to track progress towards a release goal, the focal point of any release tracking tool is the gap between the plan and reality. The basic elements of a release tracking tool — remaining points, iteration timeline, velocity — add up to a picture of what is really going on with the release.

Basic Burndown
Take the basic release burnup picture above as an example. After 3 sprints, the gap between the plan and reality has grown steadily and will likely continue to grow barring the introduction of some change. The team’s velocity and the remaining time before the planned release date (Sprint 5) are insufficient to deliver the current release target (represented as the Release Target Points).
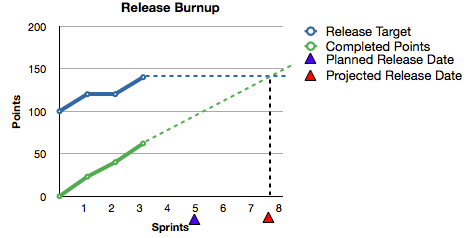
To show the implications of the data more clearly, the image below adds projection lines to the Release Target and the team’s cumulative velocity (Completed Points).
Burndown with Projections
The intersection of the projection lines marks a new Projected Release Date somewhere between Sprint 7 and 8. If this new release date is a problem, the Product Owner needs to close the gap between the plan and reality. The Gap in the following image highlights the potential problem to be solved.

Burndown Gap Highlighted
The elegant simplicity of the release burndown succinctly and clearly highlights the gap between reality and the plan as soon as the gap appears. In other words, the gap is an early call to action: Product Owners — Mind the Gap!
Note: It doesn't take a fancy tool to build the chart. In fact, most of the time, I find myself drawing the chart by hand. If you need something fancier, 10 minutes using a simple spreadsheet with charting capabilities generally does the trick. Here's the data table I created to product all of the charts above:
Release Tracking Data

